

Business success depends on the decisions made by its leaders and managers. As companies focus on achieving goals, many factors like time and budget come into play. Making mistakes is costly, so businesses need to be cautious when it comes to making decisions.
The decision-making process sets out to lead organizations to their desired outcomes. Decisions have to be clear and definite. They need to outline goals, methods, processes, and even potential challenges. Establishing a clear and organized process helps in reducing setbacks along the way.
Whether you’re learning how to become a business analyst or you have your own business to decide for, how do you know you’re making the right decisions? By utilizing decision analysis.
What is decision analysis?
One way to define decision analysis is to think of it as a systemic, quantitative, and graphic approach to assess situations. It also enables efficient ways of solving problems in business. You see this in management, operations, marketing, sales, and capital generation and investments.
It has four main components:
- Identifying objectives. Businesses need to specify their goal. This goal serves as a compass for managers to use for every decision they make.
- Gathering of information. Each goal has its unique features and requirements. It's essential to collect necessary data to figure out the business resources needed.
- Thinking of alternatives. There are many ways to achieve a goal. It’s important to have alternatives for more chances of figuring out the best options.
- Identifying potential problems. Factors outside an organization's control are important to consider. They need to see possible difficulties and how to prepare for them.

Decision Analysis Tools
There are several tools for decision analysis that can guide managers:
Multi-Criteria Decision Analysis
A decision tree analysis is a systematic diagram. It shows possible outcomes for a set of related choices. A proper decision tree has four components:
- Decision Node - represented by a square and shows the decision to be made.
- Chance Node - represented by a circle indicating uncertain outcomes.
- End Node - represent the end of the diagram. It shows the final outcome of the analysis and the basis of the decision to be made.
- Branches - each branch connecting the nodes represent alternatives available.

When using a decision tree for analysis, maintain two chance nodes. This limits the analysis to the most relevant considerations. For example, when picking suppliers, only compare between two choices. When you include every single option, it will only immobilize decision-makers. This gives them too many considerations.
Decision Matrix
A decision matrix is a decision analysis tool used when comparing several options in terms of criteria that are given different weights. It’s similar to a pros and cons list, but more precise as each criterion is assigned a specific value.
When choosing a car, for example, buyers consider cost, practicality, performance, reliability, and fuel economy. Depending on the buyer’s preference, each category will have a specific value from one to five. By giving each criterion in every option a rating, the buyer can evaluate how one choice might fare over the other. The one with the highest weighted average becomes the best option.
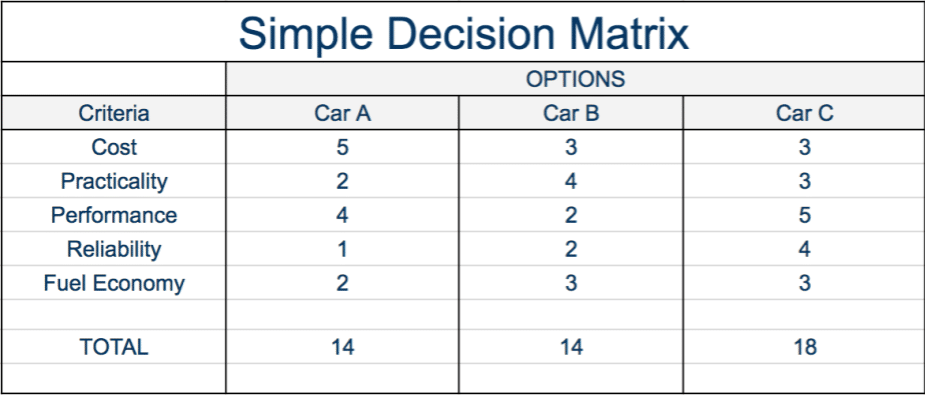
By using a decision matrix, the manager will know which option is suitable for their requirements and preferences.
Multi-criteria Decision Analysis (MCDA)
Multi-criteria Decision Analysis (MCDA) is a decision analysis tool applied in both making decisions and problem-solving. This approach focuses on the essential, reasonable, and efficient ways around a situation or a problem. It is similar to the decision matrix approach but with additional decision-makers involved and more criteria considered.
This method employs the following components:
- Identifying the goal or problem. A clear delineation of the goal or problem is required to limit the analysis within the extent of the goal or problem.
- A decision-maker or group of decision-makers. This approach considers the individuals relevant to the decision-making process.
- Decision alternatives. This refers to alternatives or options provided by the decision-makers. Usually, each decision-maker provides their own suggestion.
- Evaluation criteria. All alternatives given are measured under certain criteria.
- Outcomes or consequences. The decision-makers choose one option after evaluating the alternatives.
SWOT Analysis
Using this approach, a business plan or strategy is analyzed using four yardsticks: strengths, weaknesses, opportunities, and threats.
- Strengths. The manager identifies the assets of the company and how they can be leveraged against competitors.
- Weaknesses. This refers to identifying the undeveloped areas of the business. This may involve product quality control, customer service, or organizational structure.
- Opportunities. Managers explore the possible ways of optimizing the company’s strengths to gain a strong market presence.
- Threats. This requires identifying external factors that could possibly harm the growth of the business and how to counter them. This also determines how the existing weaknesses of the business can affect its market standing.

A SWOT analysis gives the manager the ins and outs of the business that can help him formulate decisions that will not only stabilize the business but explore its potential.
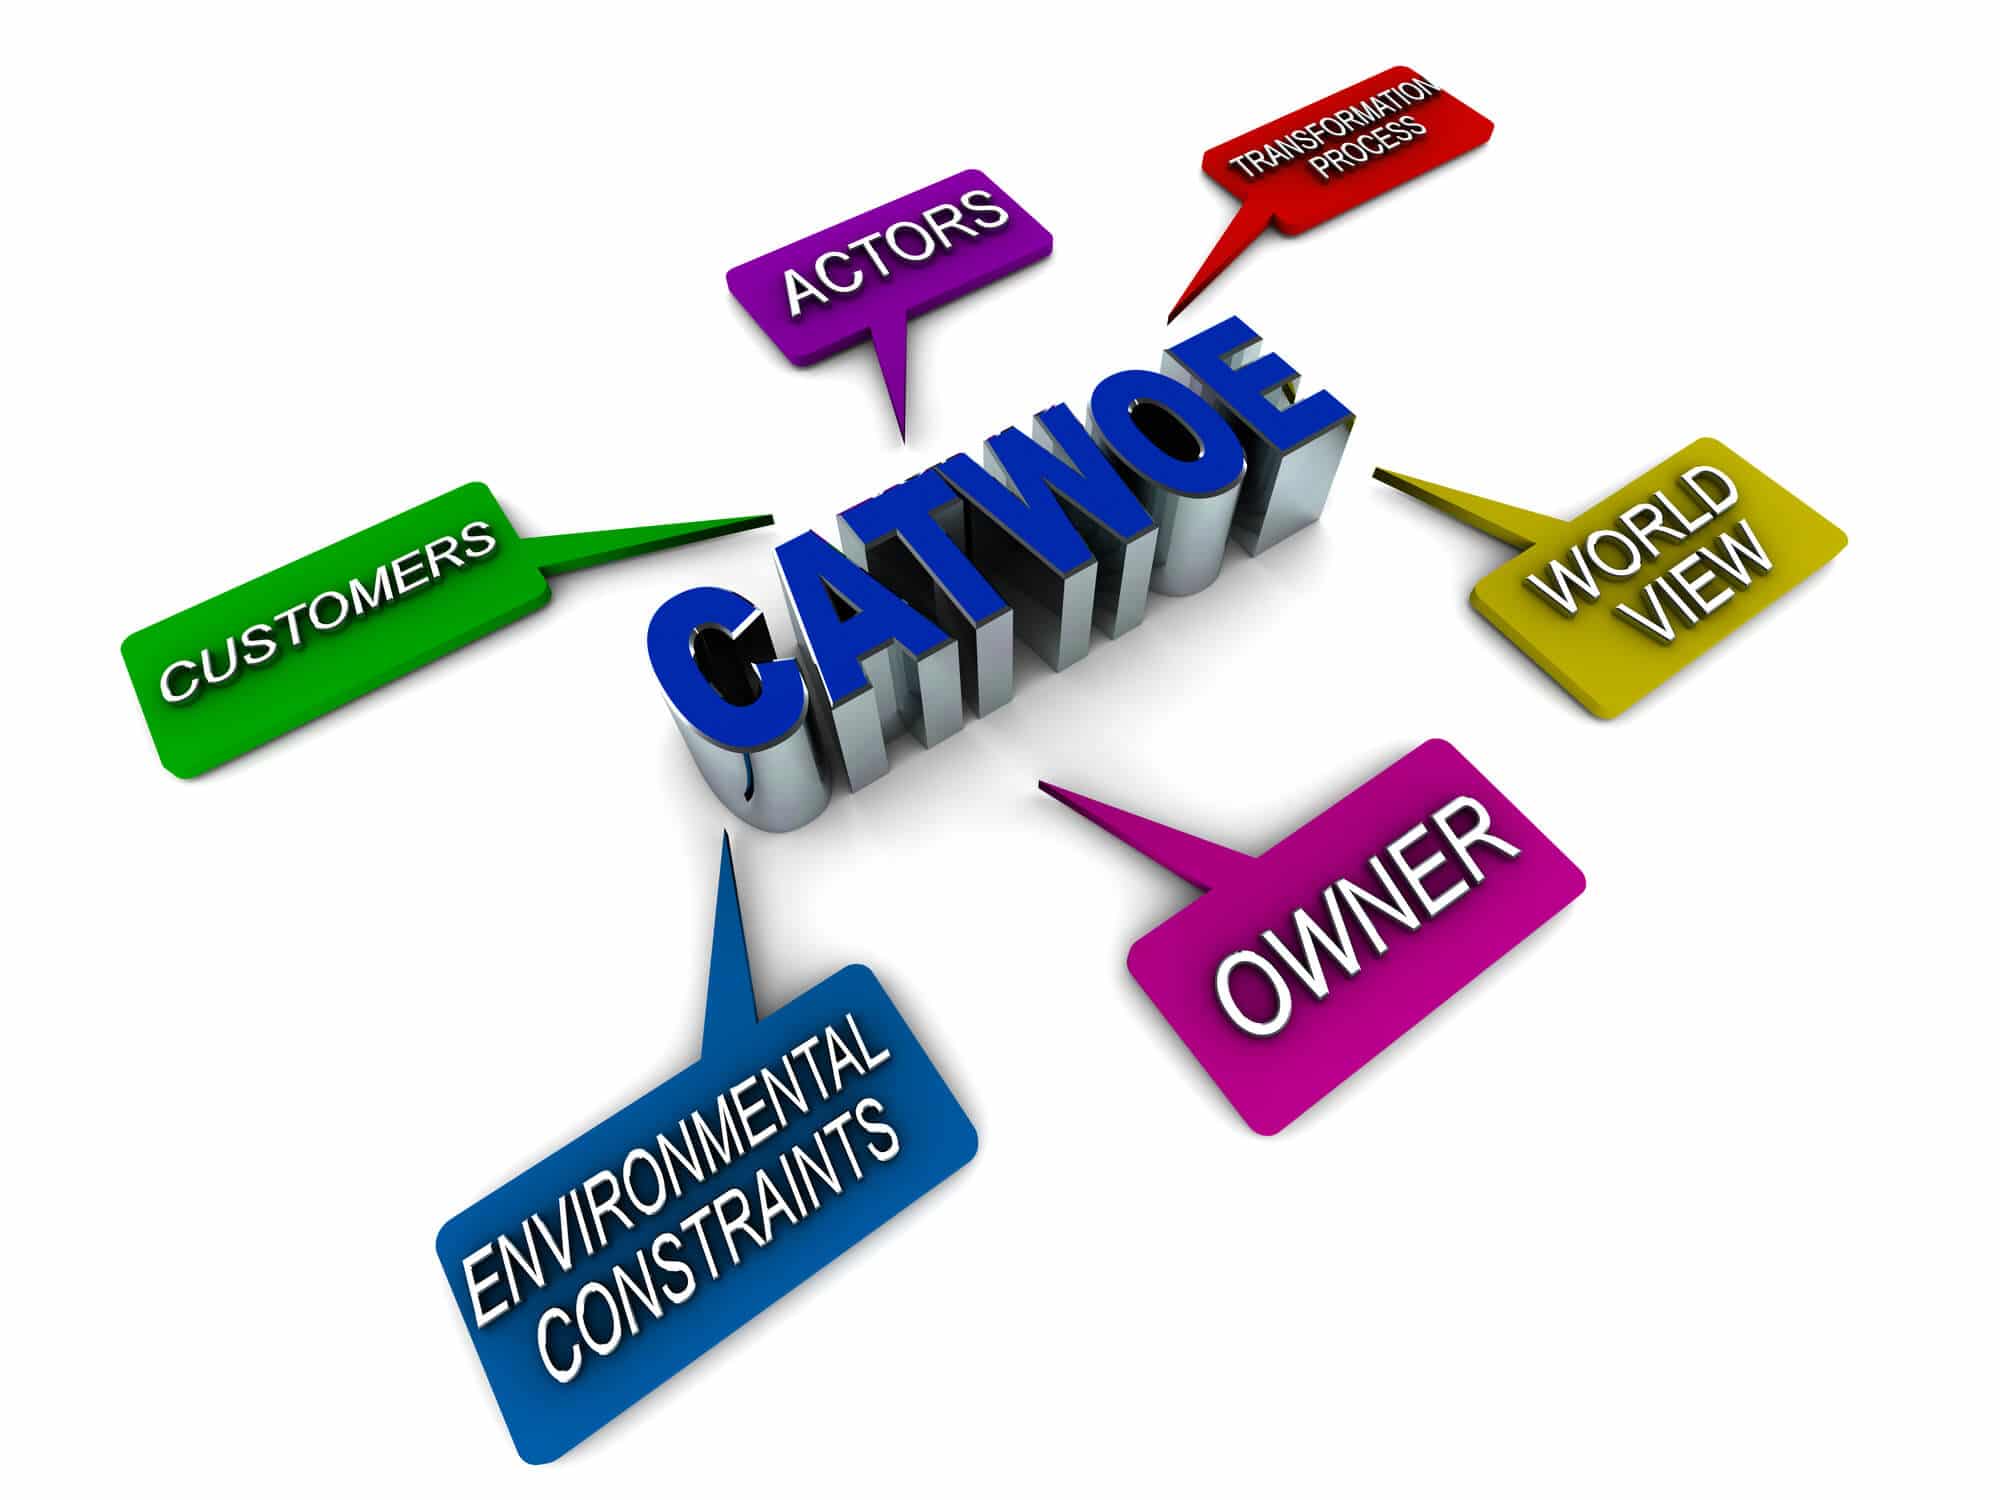
CATWOE Analysis
Another decision-making tool is CATWOE Analysis. CATWOE stands for Customers Actors Transformation World-view Owner Environmental constraints. It’s essentially a checklist for evaluating a situation or a problem, making it a useful tool for decision analysis.
Each perspective is considered to properly understand the situation. By considering all perspectives, the manager can understand the essence of the problem and approach it in innovative and efficient ways.
- Customers. These refer to the organization’s clients. They consume the company’s products or services, so it is important to identify them and their preferences. Understanding customers can help the company identify how to approach the market and innovate their products and services.
- Actors. They refer to the employees of the organization. They are the ones who mainly interact with the customers of the organization. It is important to know their abilities and interests. Identifying which personnel fit certain tasks can increase the productivity and efficiency of the company.
- Transformation Process. This refers to the relationship of the input (e.g. working hours and production processes) and output (e.g. product) of the company. Understanding the input capacity and identifying the desired outcome helps the manager with figuring out which processes to implement.
- Worldview. Under this method, the manager evaluates the organization from the eye of the public. They make decisions based on the reputation of the company. Here, they reach out more to the public through social or charity work.
- Ownership. In relation to actors, this step requires the manager to zero in on people who are part of the decision-making process. Identifying who has the capacity, interest, and commitment is important to arrive at a better and informed decision.
- Environmental Constraints. As opposed to the world view, environmental constraints look more at the immediate environmental elements surrounding the company’s system. This includes local legislation, financial limitations, and culture. Being aware of external factors prepares the company to address issues that may arise.
Data and Business Analysis
Companies need to be innovative to stay and thrive in their industry. Growing their business comes with risks. To predict and reduce these risks, business and data analysis have been growing economic trends. They are instrumental for companies to formulate sound business decisions and to adjust to shifting market demands.
The Ansoff Matrix--or the Product/Market Expansion--is a tool that helps leaders analyze the risks should they consider business expansion.
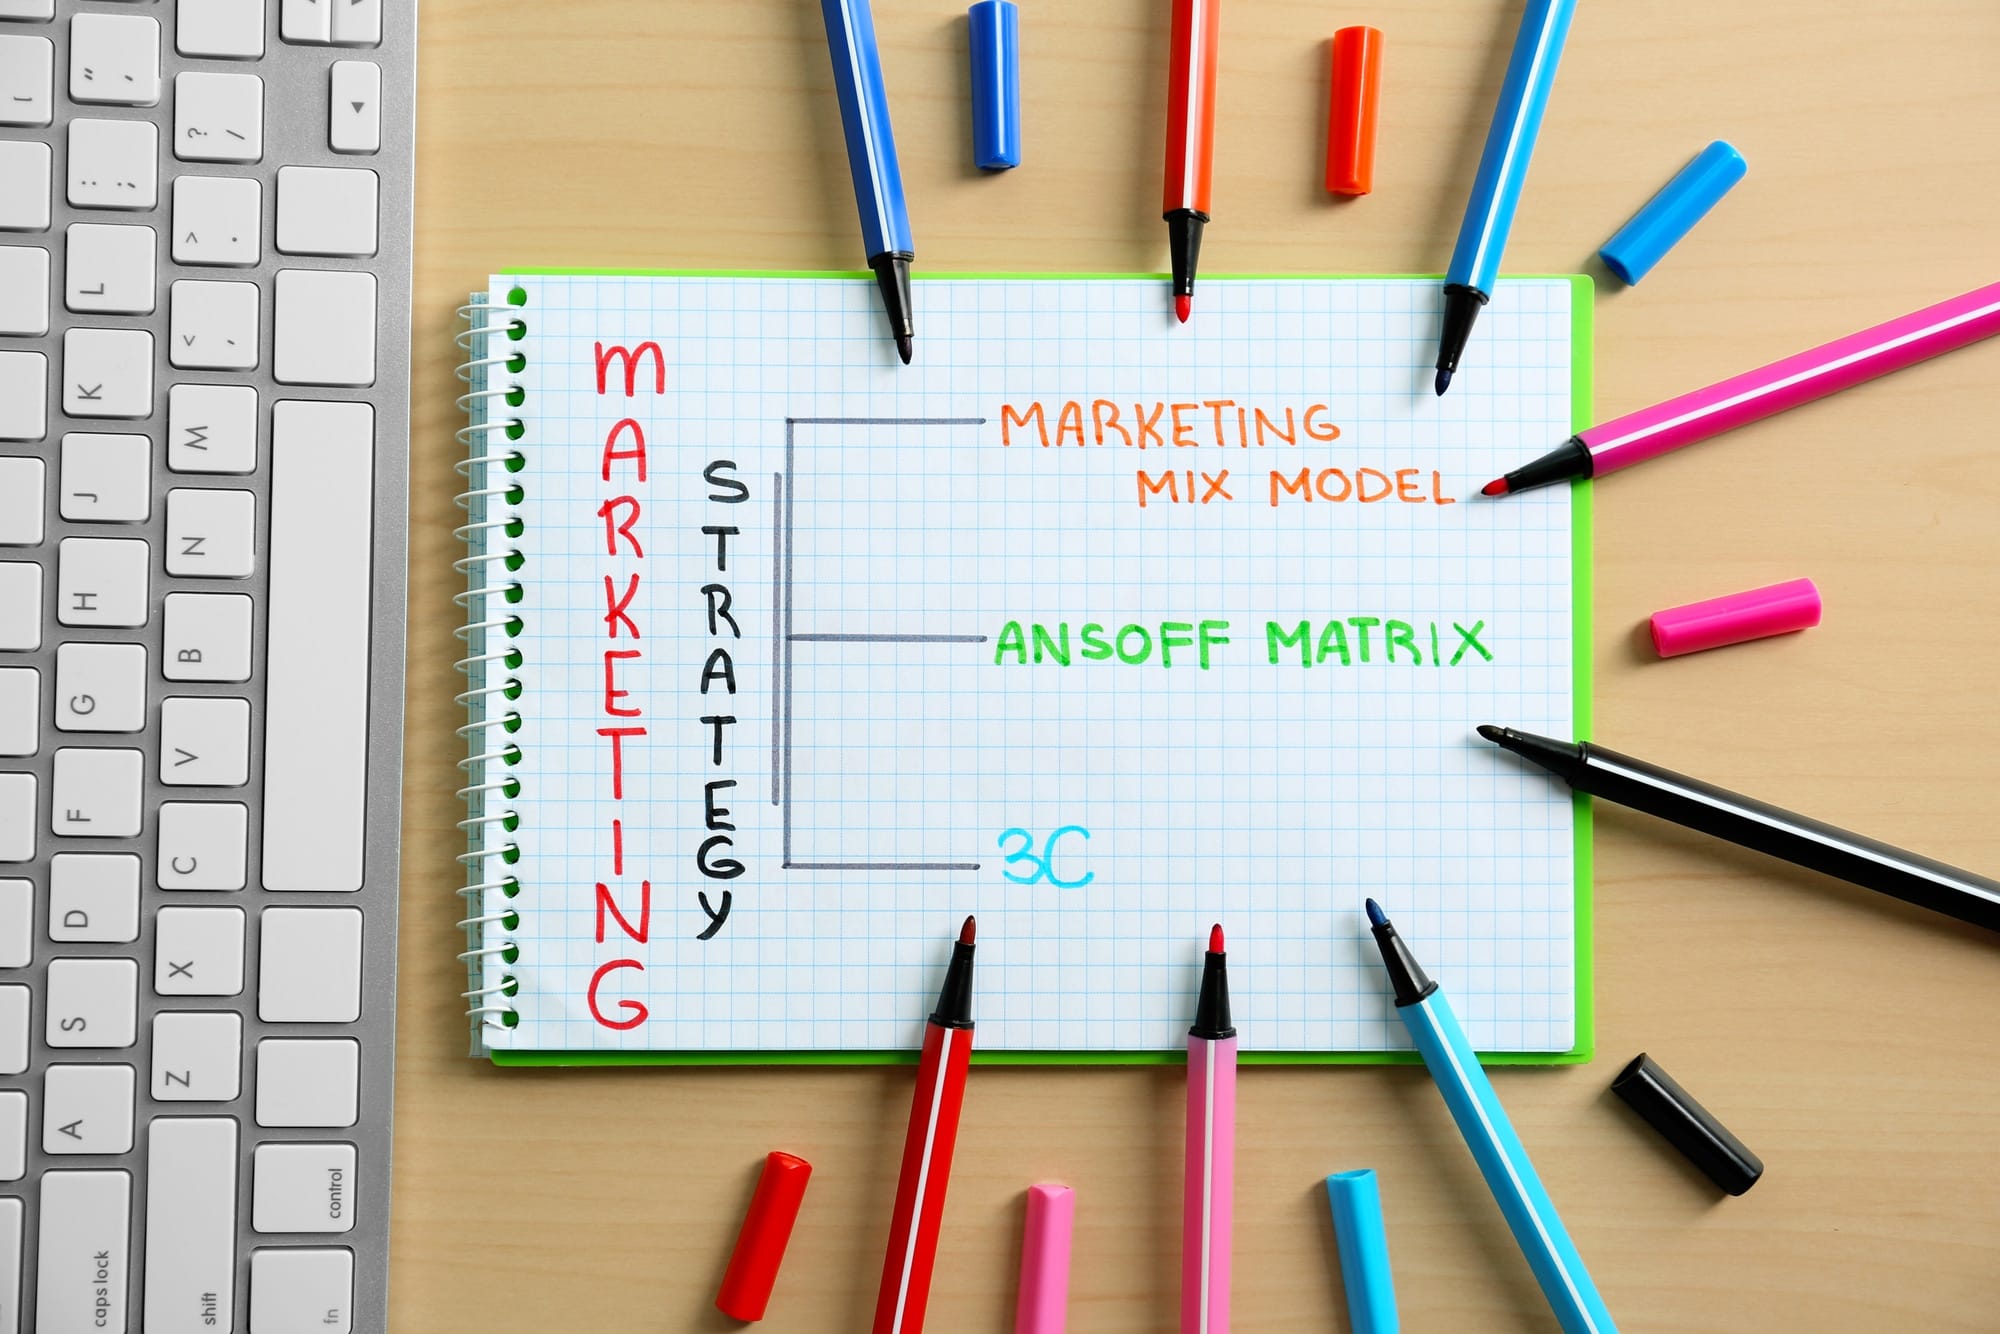
Components of the Ansoff Matrix
- Market Development. This refers to the intention to sell the same products or services to different clients. Here, the company needs to identify what its new target market is, identify how it is different, and then create strategies to successfully enter it.
- Diversification. This strategy targets selling different products or services to different groups. This is a more aggressive approach as the company needs to determine which products are marketable in different groups. This requires an extensive study on the overall market tendencies.
- Market Penetration. The intention here is to sell the same things to the same market. This can be done by trying distinct marketing strategies to attract more customers such as offering lower prices.
- Product Development. This strategy focuses on improving the product or service itself to appeal to more consumers from the same market.
When a business decides to move from one quadrant to the next, the risks involved increase due to the additional factors present.
BCG Growth-Share market
The Boston Consulting Group (BCG) growth-share matrix, invented by BCG founder Bruce Henderson, is a tool for companies to determine how to properly manage their assets. It is a four-square matrix composed of dogs, cash cows, stars, and question marks.
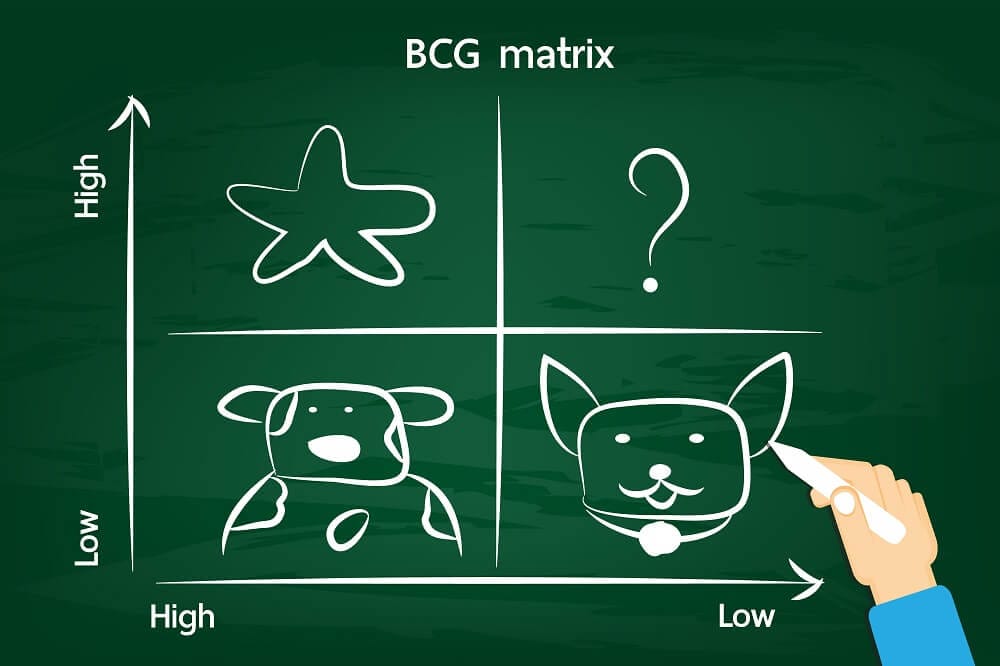
- Dogs (Pets). This refers to a company’s products that generate low sales and should be sold or liquidated. Dogs only consume the company’s resources without obtaining profit. In the quadrant, it has a low share and low growth.
- Cash Cows. These are products or services that are generating income for the company. Under the matrix, they have low growth but high share. They are considered to be more stable and steadily generate profits for the company.
- Stars. This represents the products or services of a company that have a large market share and should be invested in. Though stars can generate large sums, they also require hefty financing. If stars maintain a large market, it can turn into a cash cow even if the market remains stagnant or declines. In this quadrant, it has a high share and high growth.
- Question Marks. This refers to products or services in rapidly growing markets that the company is not considered a major player yet. They require close and frequent analysis to see if they are worth maintaining as they can have high share but low growth.


