
Everything you need to know about outlier analysis, including what it is, how it can benefit you, when to do it, what techniques to use, and how to use them.
Outlier analysis is a data analysis process that involves identifying abnormal observations in a dataset. If you want to draw meaningful conclusions from data analysis, then this step is a must. Thankfully, outlier analysis is very straightforward. In this article, we'll look at everything you need to know about outlier analysis, including what it is, how it can benefit you, when to do it, what techniques to use, and how to use them.
What Is Outlier Analysis?
Outlier analysis is the process of identifying outliers, or abnormal observations, in a dataset. Also known as outlier detection, it's an important step in data analysis, as it removes erroneous or inaccurate observations which might otherwise skew conclusions.
There are a wide range of techniques and tools used in outlier analysis. However, as we'll see later, it's often very easy to spot outlying data points. As a result, there's really no excuse not to perform outlier analysis on any and all datasets.
Benefits
Unlike other data analysis processes, outlier analysis only really has one benefit: it improves the quality of the dataset being subject to analysis. Of course, this in turn brings benefits. With a higher-quality dataset, analysts can expect to draw more accurate conclusions (and more of them).
When to Do Outlier Analysis
As mentioned, outlier analysis should be performed as part of any data analysis procedure. In this case, outlier analysis should be one of the first — if not the first — steps in data analysis. This way, when the dataset reaches steps that truly involve assessing and interpreting the data, any outliers will have already been removed.
Outlier Analysis Techniques
There are a wide variety of techniques that can be used to identify outliers in datasets. In this section, we'll look at just a few of these techniques, including both straightforward and sophisticated ones.
Sorting
For an amateur data analyst, sorting is by far the easiest technique for outlier analysis. The premise is simple: load your dataset into any kind of data manipulation tool (such as a spreadsheet), and sort the values by their magnitude. Then, look at the range of values of various data points. If any data points are significantly higher or lower than others in the dataset, they may be treated as outliers.
In order to make effective use of sorting, it's helpful to know what range of values to expect within a dataset. As a result, someone who is very familiar with certain types of data will be much more adept in identifying outliers using this approach.
Let's look at an example of sorting in practice. Consider that scientists are measuring the calories in one hundred different chocolate bars. Upon entering the data analysis phase, they should look to make sure no outliers are present in the dataset. By sorting from the highest values, they will be able to identify unusually high observations. Knowing that the average chocolate bar has several hundred calories, an observation of several thousand calories would clearly stand out as an outlier.
Graphing
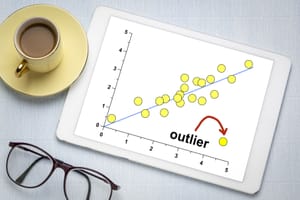
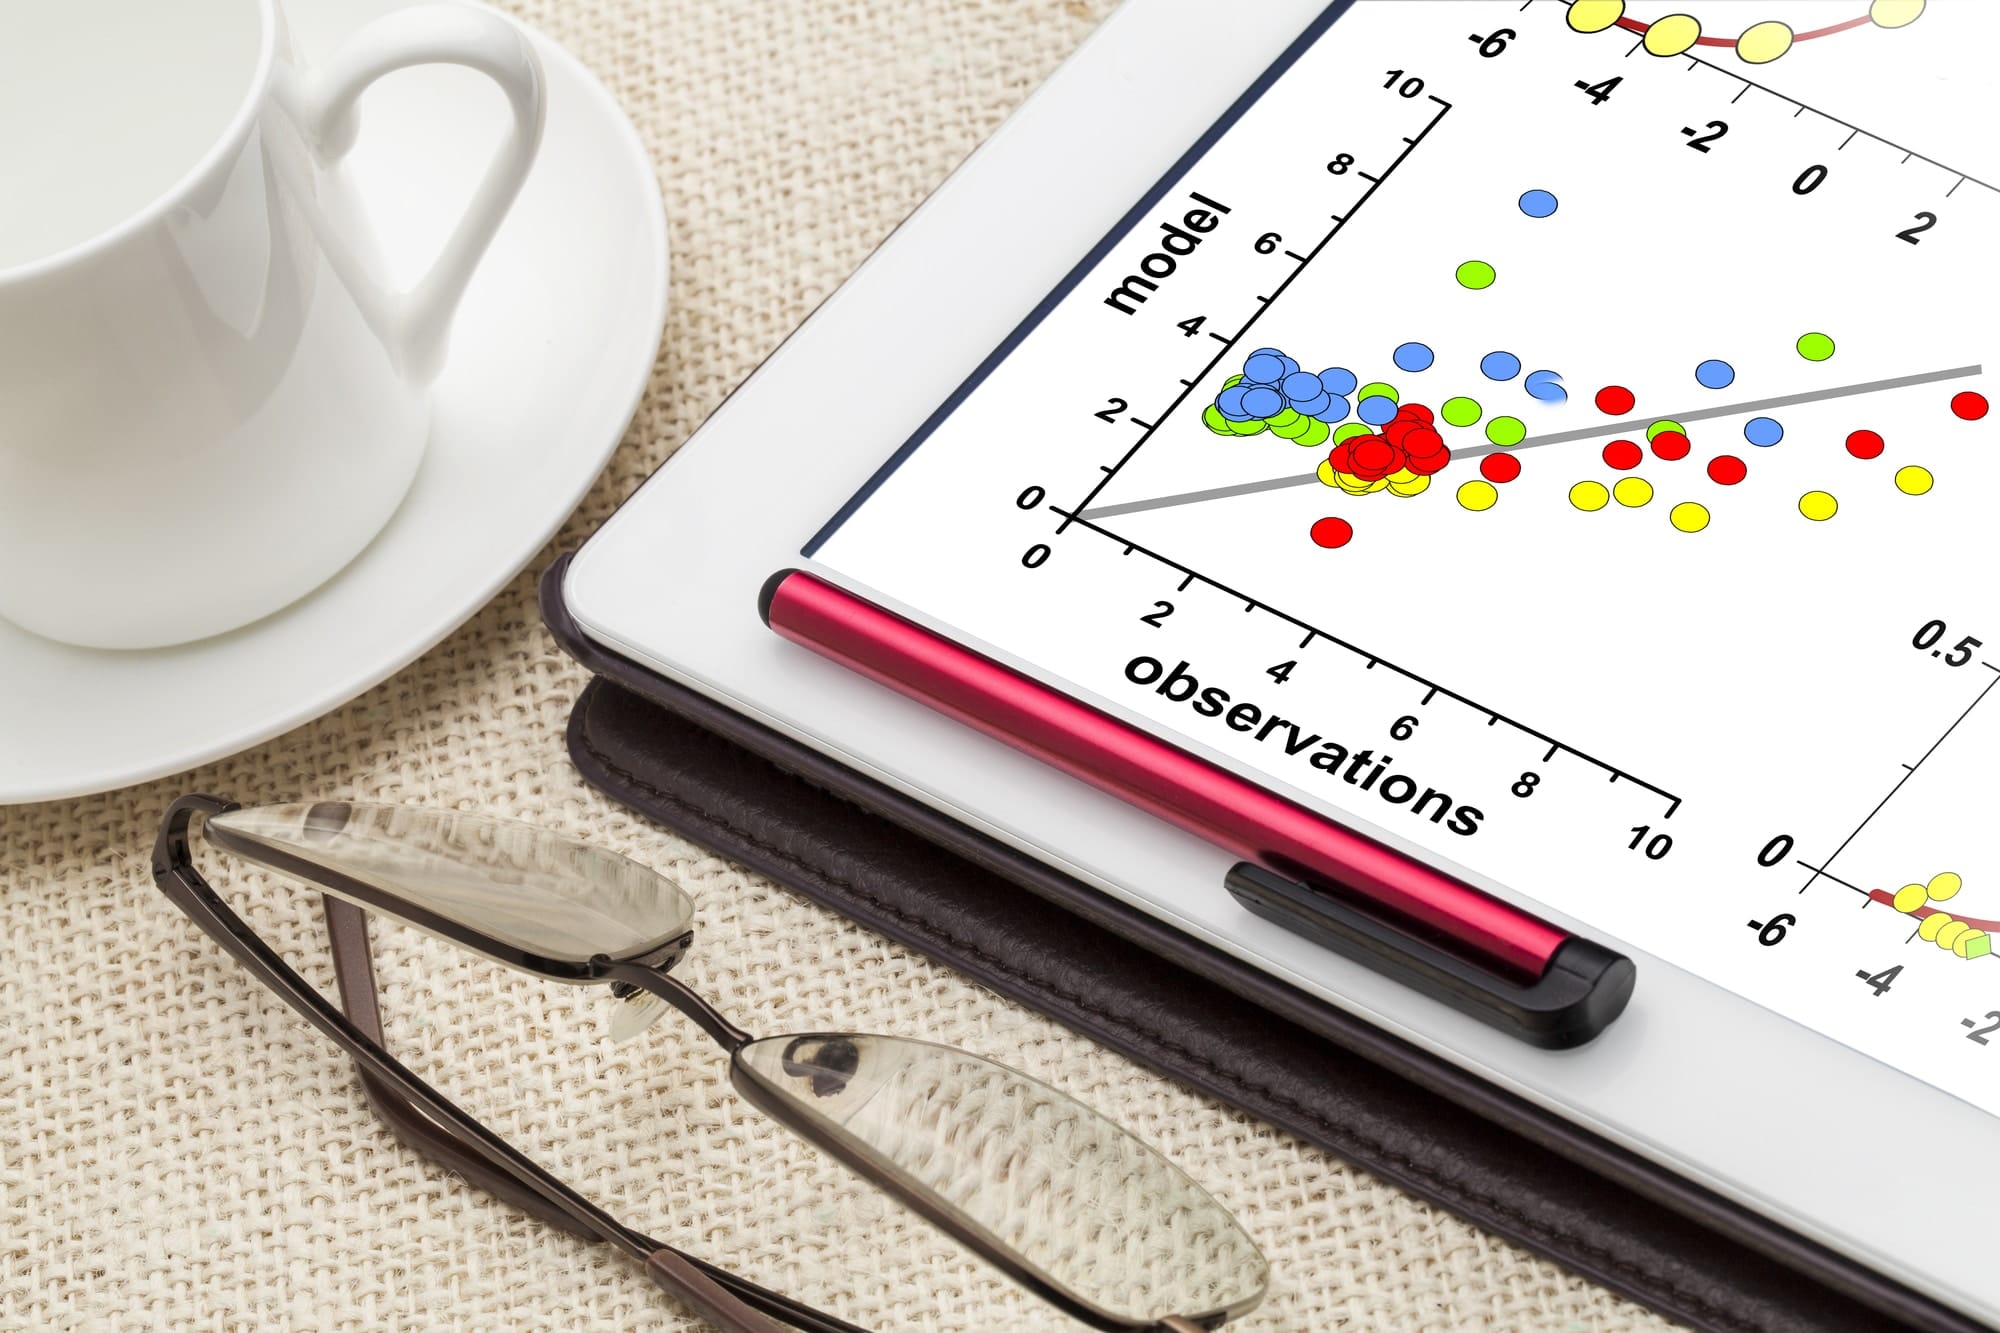
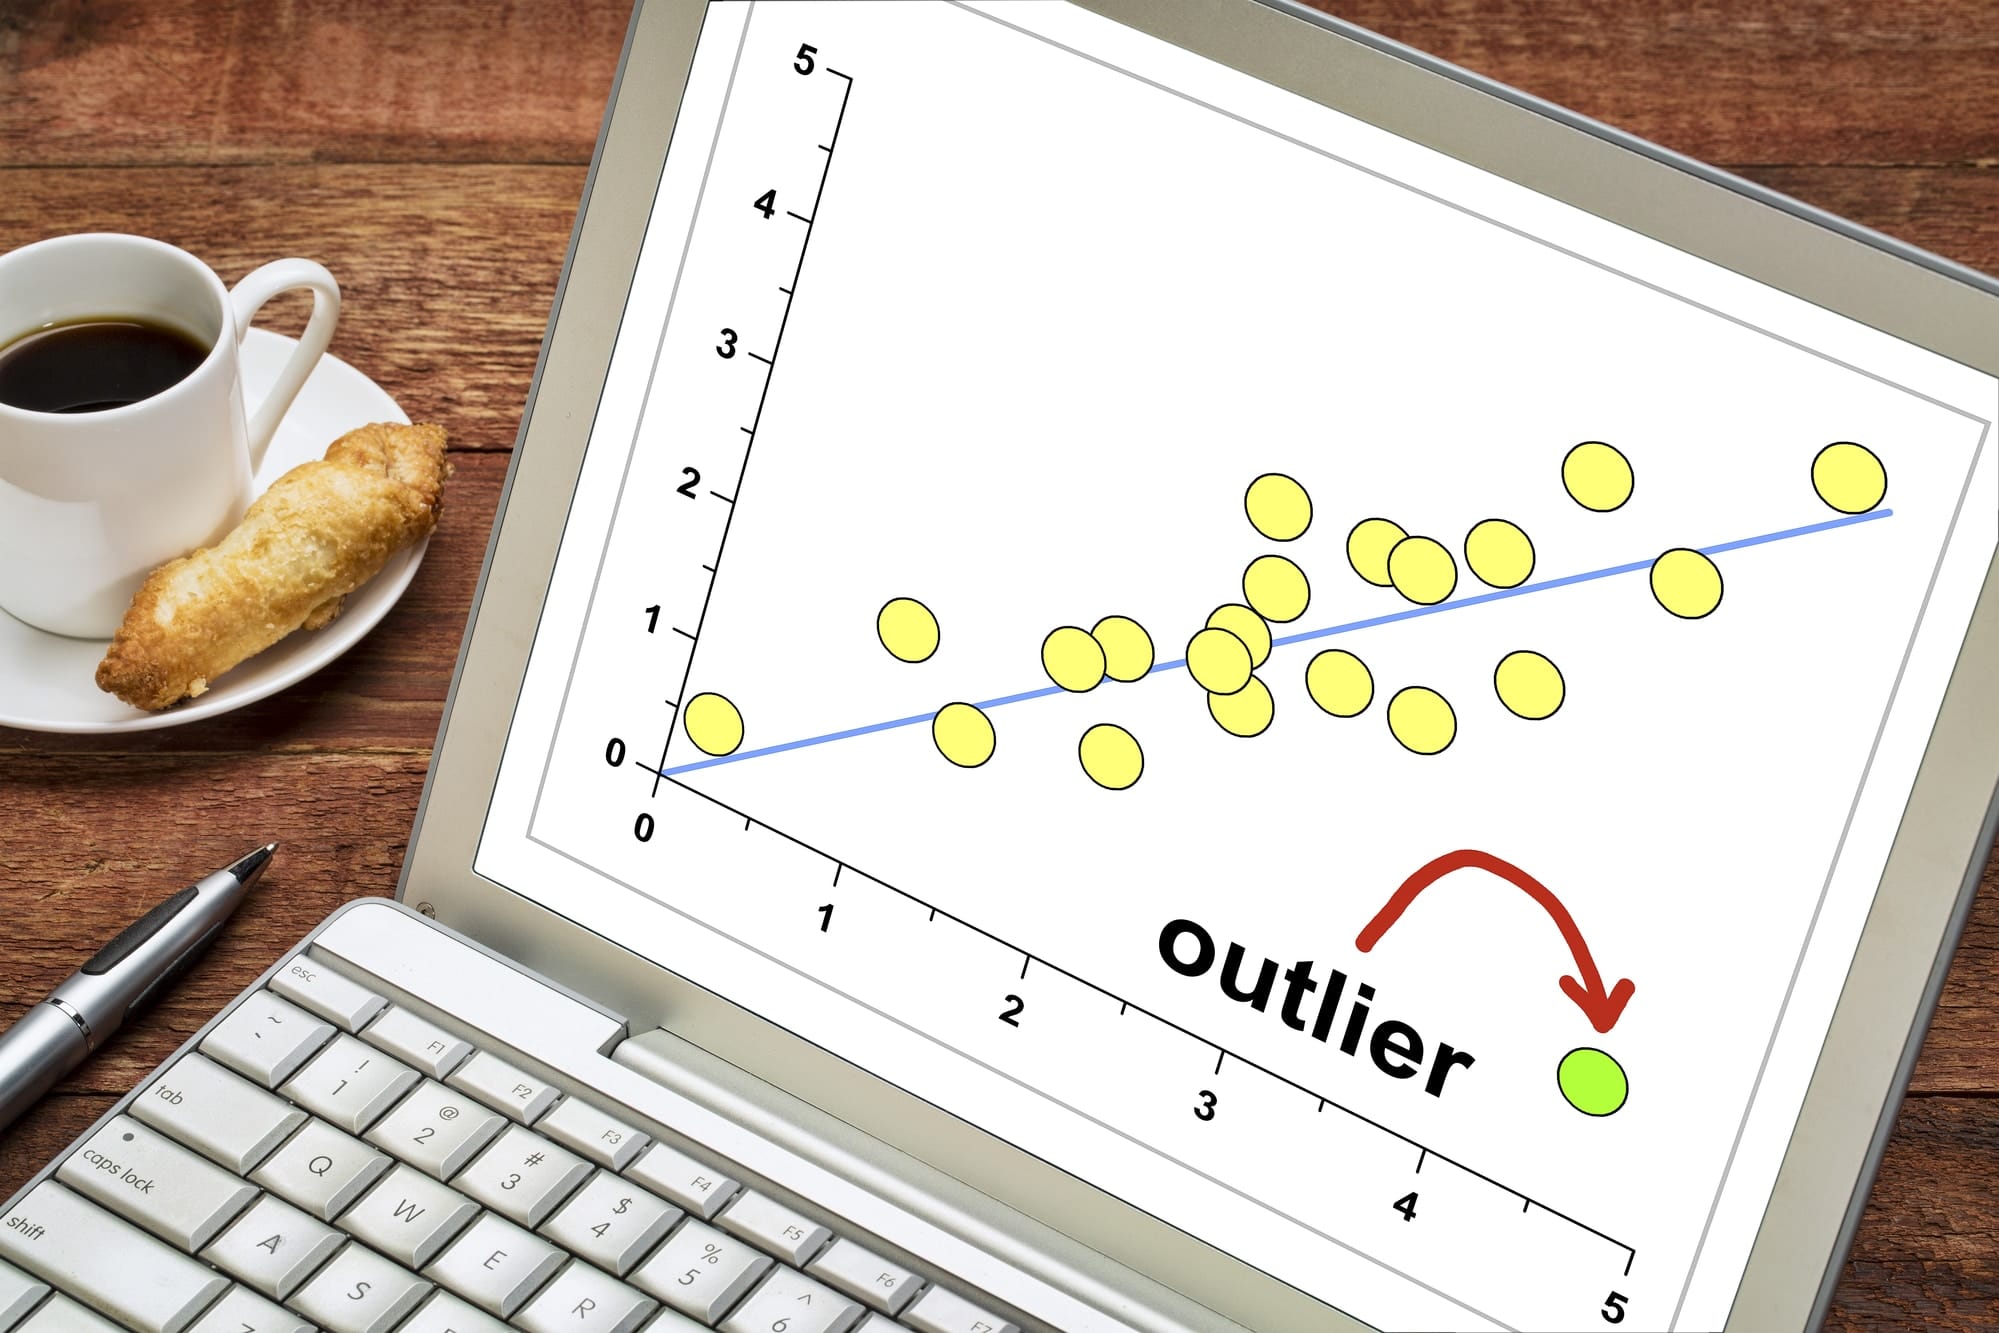
An equally forgiving tool for outlier analysis is graphing. Once again, the premise is straightforward: plot all of the data points on a graph, and see which points stand out from the rest. The advantage of using a graphing approach over a sorting approach is that it visualizes the magnitude of the data points, which makes it much easier to spot outliers.
Graphing can also be especially effective if the data points involved are very high or very low numbers. As it may be difficult to grasp the difference in values with extreme orders of magnitude, the fact that graphs can be drawn to a suitable scale is particularly helpful.
Yet another reason why graphing is so useful is that it allows analysts to compare the relationship between two variables. For example, consider a graph of the temperatures recorded at various times during the year. It's much easier to spot outliers (which are above or below the trend of the graph) this way than it is by sorting the temperatures, as that would not take into account the time of the year.
Z-score
A more statistical technique that can be used to identify outliers is the Z-score. The Z-score measures how far a data point is from the average, as measured in standard deviations. By calculating the Z-score for each data point, it's easy to see which data points are placed far from the average. Unfortunately, like sorting, this doesn't take into account the influence of a second variable.
Other tests
Aside from sorting, graphing, and Z-scores, there are a whole host of statistical tests that can be used to identify outliers in a dataset. For most intents and purposes, sorting and graphing are more than enough for outlier analysis. Z-scores or other statistical tests may only be necessary for academic or high-stakes purposes, where the true statistical aspect is much more important.
How to Do Outlier Analysis
Conducting outlier analysis couldn't be easier. Before you can dive into applying the techniques discussed above, there's just one thing you need to do: normalize your data. Normalization is the process of ensuring that all of the data points in a dataset are formatted in the same way, so that they can be manipulated equally. Without normalization, it may be impossible to sort, graph, or otherwise assess datasets.
As soon as the data is appropriately and consistently formatted, you can dive in with any or all of the techniques discussed above. And once any outliers have been spotted, you can remove them from your dataset and proceed with further analysis!
Final Thoughts
Outlier analysis is an easy but important step in data analysis. By removing abnormal observations — which are often incorrect or inaccurate — you can draw stronger conclusions from your datasets. For the casual analyst, all it takes is sorting or graphing your data, and leaving the rest to intuition. Of course, there are a variety of statistical techniques (such as Z-scores, but also numerous more advanced ones) that can also be applied for a more objective outlier analysis framework.